Indicator Definition: Meaning in Trading and Investing
Learn what Indicator means in trading and investing, how it’s used across stocks, forex, and crypto, and how to interpret it with practical examples and key risks.
Learn what Indicator means in trading and investing, how it’s used across stocks, forex, and crypto, and how to interpret it with practical examples and key risks.
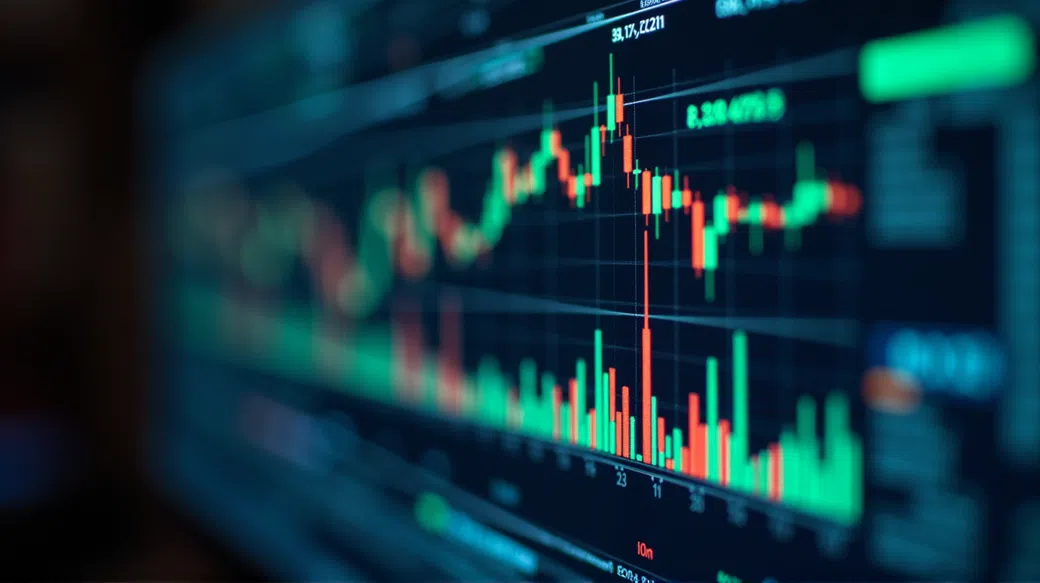
Indicator is a tool or data point used to help interpret market behaviour and support decisions in trading and investing. In practice, an Indicator (also known as a signal) turns raw information—most often price, volume, or economic data—into something you can compare, track, and act on. Traders use these measures to frame scenarios: is momentum strengthening, is volatility rising, or is a trend losing steam?
In Singapore, where many desks watch both APAC flows and US macro, you’ll see the same concept applied across stocks, forex, and crypto. A chart-based technical study might help time entries; a macro metric like inflation might shift rate expectations and reprice currencies. The key is that an Indicator informs probability, not certainty. It can be helpful, but it is never a guarantee of profit and it can fail—especially when regimes change or liquidity dries up.
Disclaimer: This content is for educational purposes only.
In trading, an Indicator is best understood as a decision aid: it summarises complex price action or fundamental inputs into a cleaner, repeatable output. Think of it as an analytical tool that answers a narrow question—“Is momentum accelerating?” “Is the market stretched?” “Is volatility compressing?”—so you can structure a trade rather than react emotionally to every candle.
Most traders split these tools into broad buckets. Technical indicators are derived from market data such as price and volume (for example, moving averages or oscillators). Fundamental indicators come from the real economy and policy expectations (growth, inflation, employment, central-bank guidance). Both are “indicators” in the financial sense, because they indicate conditions that can influence valuation and positioning.
Importantly, the output is not a command to buy or sell. A reading is a trading signal only after you define rules: timeframe, trigger level, confirmation, and invalidation. In derivatives terms, you’re converting information into a payoff profile—where you know what would make the idea wrong and how much you’re willing to lose if it is.
In stocks, an Indicator often supports trend-following and mean-reversion decisions. A chart study might help you separate a healthy pullback from a breakdown, while breadth or volume measures can hint whether participation is widening or narrowing. Investors on longer horizons may rely more on macro and earnings-related gauges, using them to adjust exposure rather than time precise entries.
In forex, indicators are frequently tied to rates and risk sentiment. A macro readout—such as inflation surprising higher—can shift yield differentials and reprice a currency quickly. Technical tools still matter, but many FX moves are regime-driven; the same setup can behave differently when the market transitions from “carry-friendly” to “risk-off.”
In crypto, where market structure can be thinner and reflexivity is real, traders lean on momentum and volatility measures. A market metric like realized volatility or funding rates may be as relevant as price-based studies, because positioning and leverage can dominate short-term moves.
Across indices, time horizon is everything. Intraday traders use fast indicators to manage execution and risk, while swing traders prefer slower measures that reduce noise. In all cases, the professional use-case is planning: defining entry conditions, setting stop levels, sizing positions, and deciding when to stand aside.
Start with regime. An Indicator is most useful when you know whether the market is trending, ranging, or transitioning. In a strong trend, a trend gauge (like a moving average slope) can keep you aligned with the dominant direction and avoid premature fades. In a range, the same tool may generate late entries and repeated whipsaws.
Volatility also changes what “normal” looks like. When volatility expands, price can overshoot typical levels and invalidate neat mean-reversion assumptions. When volatility compresses, breakouts may become more meaningful but also more prone to false starts. Recognise liquidity conditions too: thin sessions and event risk (data releases, central bank decisions) can distort signals.
Next, look for confluence. A single technical study rarely deserves full weight on its own. Instead, combine tools that answer different questions: trend (moving averages), momentum (oscillators), and participation (volume or breadth). For example, “price makes a new high” matters more when momentum confirms and volume supports the move.
Be specific about triggers. Define what a valid signal is (cross, breakout, divergence), what confirms it (close above a level, multi-timeframe alignment), and what invalidates it (close back inside a range, failure to follow-through). This turns a vague reading into a testable framework.
Finally, respect context. A macro barometer—inflation trend, growth momentum, or policy guidance—can explain why technical signals either work cleanly or fail quickly. Sentiment also matters: positioning, risk appetite, and narrative can drive sharp squeezes and air pockets. When the market is crowded, an indicator that typically signals “overbought” may stay stretched longer than expected.
The practical approach is to treat each readout as conditional: “If the macro backdrop supports it and price confirms, then I take the setup; if not, I size down or pass.”
The biggest mistake with any Indicator is treating it as certainty rather than information. Many tools are derived from past price, so they can be late in fast markets. Even forward-looking macro indicators can be revised, misread, or overwhelmed by positioning and liquidity. A signal is only as good as the rules and context around it.
Professionals treat an Indicator as one input in a repeatable process. On a derivatives desk, a decision tool is often paired with volatility, liquidity, and positioning checks before any risk is put on. The emphasis is on distributions: what’s the expected move, what’s the drawdown risk, and how does the trade behave if the market gaps?
Retail traders can apply the same discipline with simpler rules. Use a small set of indicators with clear purposes (trend, momentum, volatility), define entry and exit criteria, and keep position sizing consistent. Stops are not optional; they are the price of staying in the game. If a setup requires a wide stop, reduce size rather than “hoping” it comes back.
For investors, indicators are often used to manage exposure rather than to time perfect bottoms and tops. A market metric that signals rising volatility may justify trimming risk, rebalancing, or hedging. For practical next steps, study a dedicated Risk Management Guide and build a checklist that you can follow under pressure.
To go further, focus on the basics—position sizing, stop discipline, and diversification—then layer indicators on top as structured inputs, not shortcuts.
It is neither good nor bad on its own; an Indicator is useful when it is matched to the market regime and your timeframe. Used as a decision aid with risk rules, it can improve consistency.
It means a number or tool that helps you read the market, like a signal for trend strength or volatility.
Beginners should start with one or two simple tools, write clear rules, and backtest on historical charts. Use the chart study to plan entries and stops, not to chase every move.
Yes, an Indicator can be misleading when conditions change, liquidity is thin, or the market is range-bound. Treat each readout as probabilistic and manage downside first.
Yes, you should understand what an Indicator measures and when it fails before risking real money. Basic knowledge of risk management matters even more than any single tool.